Biopsie measurement (ImageXd)
Local measurements can be made using a mesh. Calculations are made along or against the normal vectors.
For the colors, see: color map
color.map.volume1 5 500
scalar.load “test.nii.gz”
mesh.normal.min 1000 // for values range
mesh.normal.max 4000 // for values range
mesh.normal.inverse true
mesh.load “test.obj”
mesh.getdensity.color 5 // 10
mesh.save “test.ply”
|
 |
 |
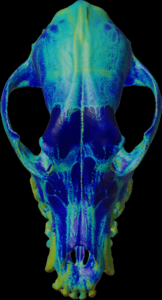
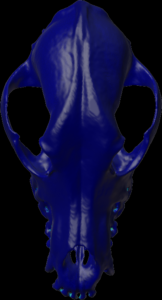
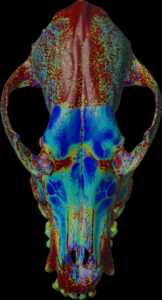
Calculation of the max density along the negative mesh normal vectors.
For the colors, see: color map
color.map.volume1 5 500
scalar.load “test.nii.gz”
mesh.normal.min 1000 // for values range
mesh.normal.max 4000 // for values range
mesh.normal.inverse true
mesh.normal.method 7
// 0=sum 1=mean(default) 2=sd
// 3=min 4=Q.25 5=median 6=Q.75 7=max
mesh.load “test.obj”
mesh.getdensity.color 5 // 10
mesh.save “test.ply”
|
 |
 |
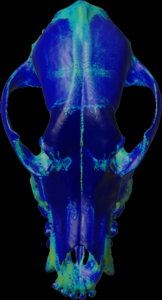
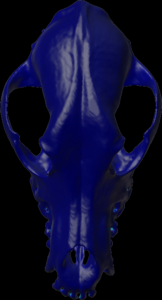
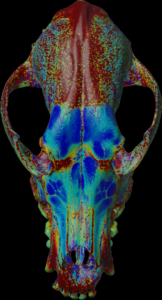
Calculation of the mean density along the mesh normal vectors.
For the colors, see: color map
color.map.volume1 5 500
scalar.load “test.nii.gz”
mesh.normal.min 1000 // for values range
mesh.normal.max 4000 // for values range
mesh.normal.inverse false
mesh.load “test.obj”
mesh.getdensity.color 10 // 20
mesh.save “test.ply”
|
 |
 |
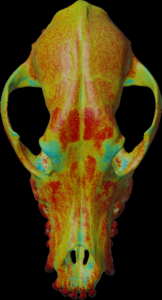
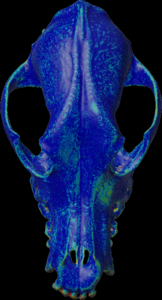
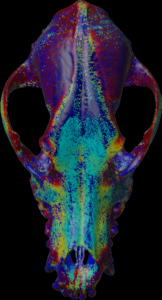
Calculation of the max density along the mesh normal vectors.
For the colors, see: color map
color.map.volume1 5 500
scalar.load “test.nii.gz”
mesh.normal.min 1000 // for values range
mesh.normal.max 4000 // for values range
mesh.normal.inverse false
mesh.normal.method 7
// 0=sum 1=mean(default) 2=sd
// 3=min 4=Q.25 5=median 6=Q.75 7=max
mesh.load “test.obj”
mesh.getdensity.color 10 // 20
mesh.save “test.ply”
|
 |
 |
Note: You can also use: mesh.normal.method with 0=sum 1=mean(default) 2=sd 3=min 4=Q.25 5=median 6=Q.75 7=max
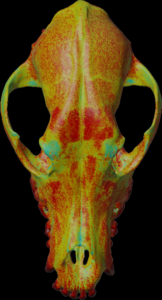
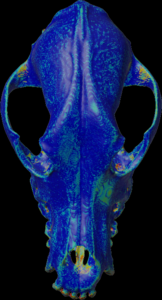
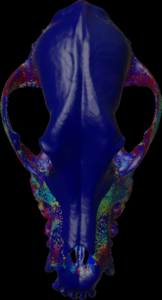
Calculation of the length (values > threshold) along the negative mesh normal vectors.
For the colors, see: color map
color.map.volume1 5 500
scalar.load “test.nii.gz”
mesh.normal.min 0 // length for color
mesh.normal.max 30 // length for color
mesh.normal.inverse true
mesh.load “test.obj”
mesh.getthickness.color 50 800 // 100 800
mesh.save “test.ply”
|
 |
 |
Calculation of the length (values > threshold) along the mesh normal vectors.
For the colors, see: color map
color.map.volume1 5 500
scalar.load “test.nii.gz”
mesh.normal.min 0 // length for color
mesh.normal.max 30 // length for color
mesh.normal.inverse false
mesh.load “test.obj”
mesh.getthickness.color 50 800 // 100 800
mesh.save “test.ply”
|
 |
 |